You’ve looked at how customers use products in your category and have created new concepts that will make for a better experience. You’ve tested these concepts with end users and verified that these are changes they’d like to see. But is this a real business opportunity? How much value would these features add? How much would your end users expect to pay for these changes? The van Westendorp Price Sensitivity Meter can be used learn what range of prices customers would consider reasonable.
How it works
This methodology makes a couple assumptions. First, it assumes that survey respondents are familiar enough with the product category to have a sense of what price ranges they’d expect to see. Second, it assumes that the suggested retail price says something about the quality of the product, that is, cheap products cost less, and quality products cost more.
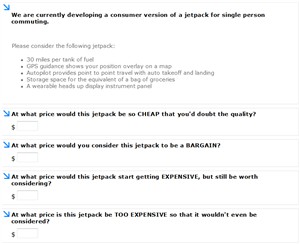
Once a thorough product description is given, the respondent is asked four price related questions. At what price would they consider the product cheap, that is, so inexpensive that they’d doubt the product’s quality? At what price would they consider it a bargain? At what price would the product start getting expensive? At what price would they consider the product too expensive to consider purchasing?
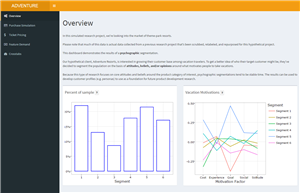
With this feedback and a large enough sample, we can make some inferences about what a reasonable range of prices would be. The price at which more people would consider the product “cheap” than consider it a “bargain” defines the low end of reasonable prices. Any cheaper and the price would turn off more consumers than attract them with a good price.
The price at which more people would consider the product “too expensive” than just getting “expensive” defines the high end of reasonable prices. Any more expensive, and more people would stop considering it than would still consider buying it at the expensive price.
Pros:
-
The Price Sensitivity Meter provides a relatively simple, straightforward way to assess what customers would be willing to pay for your product before committing to production. Further, when crossed with additional customer information, such as demographics, hobbies, etc., this analysis can help determine what types of customers think it’s reasonable for your product to be higher priced. Even if the cost of production is high, targeted marketing of these customers may still justify moving forward with production.
Cons:
-
This method assumes both that customers are familiar with the product category and that price signals quality. Because of these assumptions, this method might not be appropriate for novel product categories, or free products that earn revenue through advertising or other means that don’t require customers to pay for the service.
-
Also, the bare-bones approach only gives information on what customers expect a reasonable price would be. Additional questions need to be included to estimate purchase likelihood. But this has drawbacks as well. Customers make purchase decisions in a competitive marketplace where they often have to decide between competing brands and make tradeoffs between what they’d like to buy and how much they’d like to spend. So, while we may learn that customers may be willing to purchase your product at a certain price point, we don’t know whether they’d prefer your product over the competition, or be willing to sacrifice functionality for a cheaper version of the product. If you’re operating in a highly competitive, mature marketplace, other approaches may be more suitable.